Goals
In this project, I use classification to look whether a game is good or bad.
Data Dictionary
1. Title : The title of the game.
2. Rating : The game’s rating on sites (Low, Average, High).
3. Popular : Whether the game is popular or not in the community.
4. SalesPerWeek : The game’s total sold unit(s) per week.
5. SalesPerWeek : The game’s price.
6. ReqSpec : The game’s requirement specification to play.
7. Overall : Whether the game is good or not.
Dataset
You can download the dataset on Github .
Source Code
Library
1. when : to define conditional expressions in PySpark DataFrame operations.
2. VectorAssembler : for combining multiple feature columns into a single vector column.
3. StandardScaler : it provides a mechanism for scaling input features by standardizing them to have zero mean and unit variance.
4. LogisticRegression : it represents a logistic regression model in PySpark.
5. BinaryClassificationEvaluator : to evaluate the performance of binary classification models.
Import Data and Preview
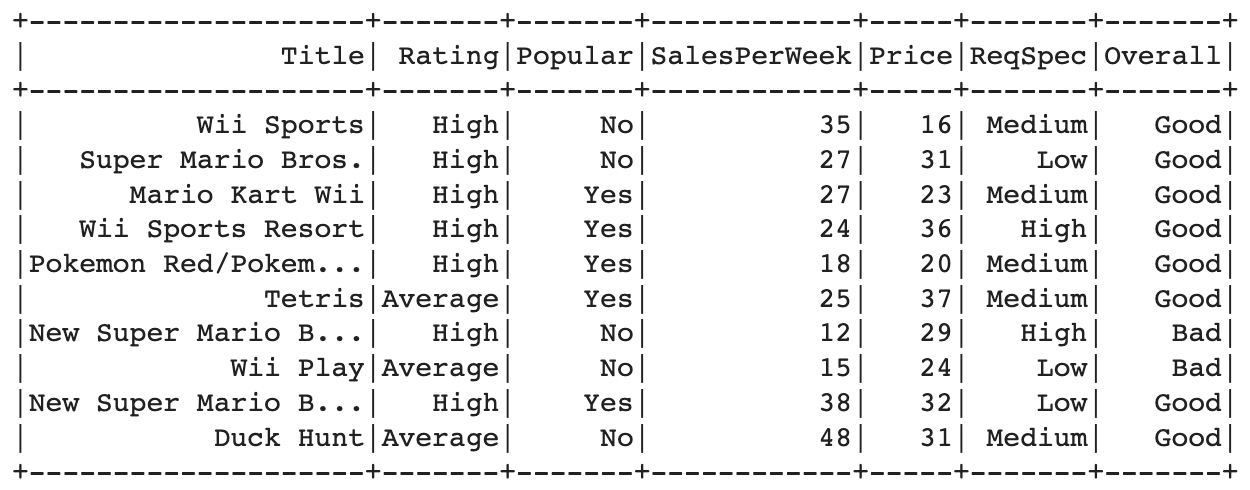
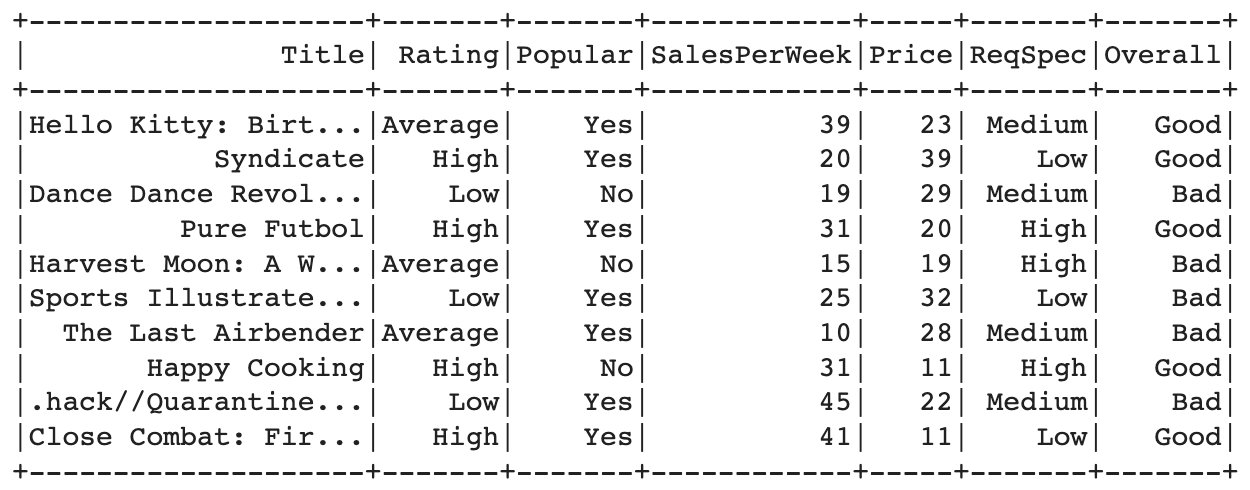
After import the library, then import the dataset. Here is the code for loads the training and testing data from CSV files ("GameTrain.csv" and "GameTest.csv") with the option to infer the schema and considering the first row as the header row.
Select Features
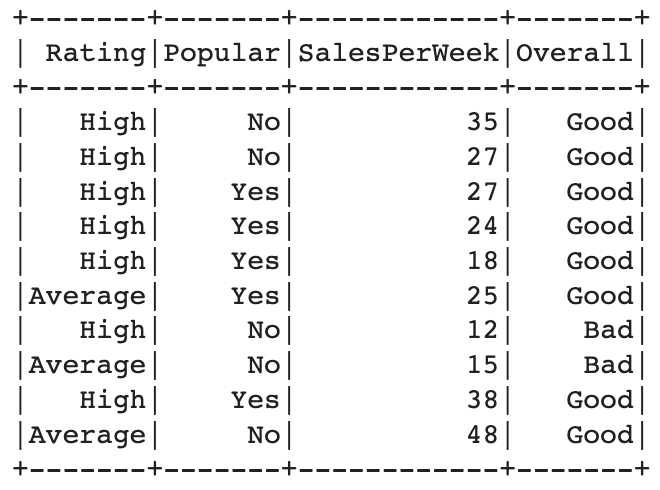
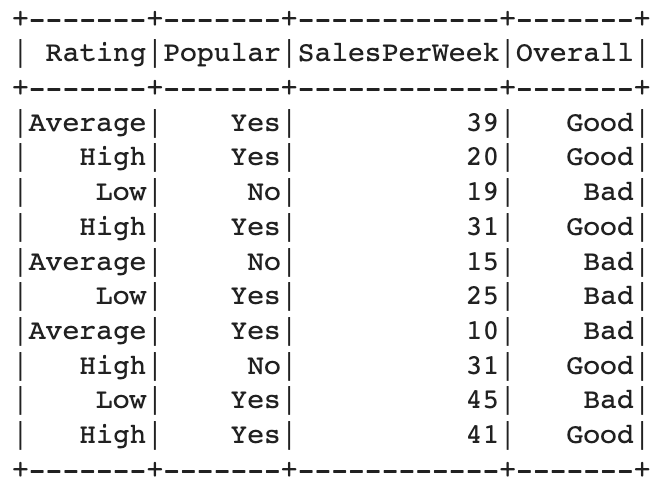
After that, selects the features "Rating", "Popular", "SalesPerWeek", and "Overall" for both the training and testing datasets.
Preprocessing
In this step, we used na.drop() to remove any rows with missing values from the training and testing datasets.
Transformation
In this step, transforms the data by converting categorical values in the "Rating", "Popular", and "Overall" columns to numerical values. The "Rating" column is mapped to 0 for "High", 1 for "Average", and 2 for other values. "Popular" is mapped to 0 for "Yes" and 1 for other values. "Overall" is mapped to 0 for "Good" and 1 for other values.
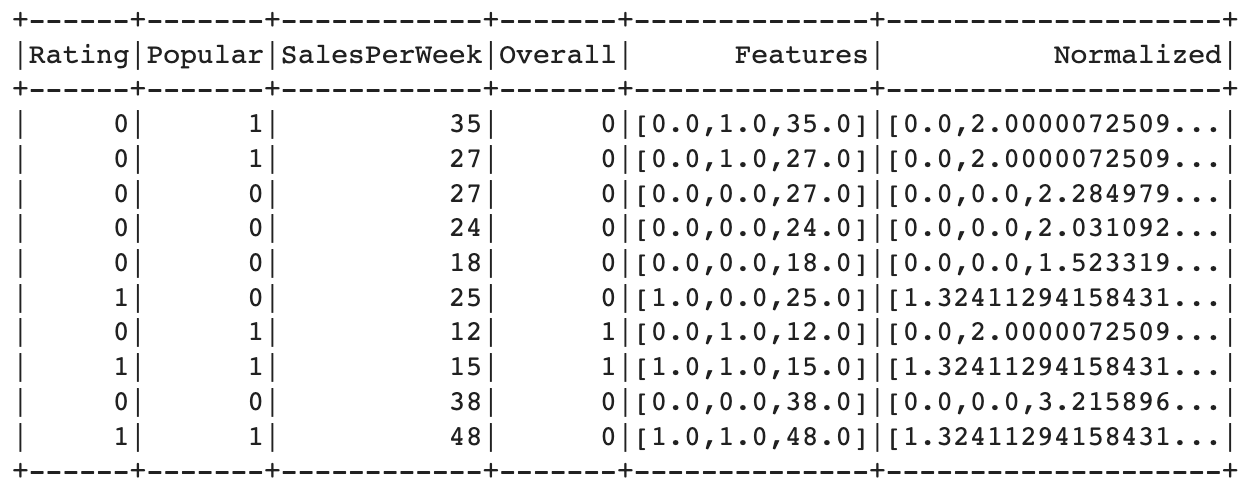
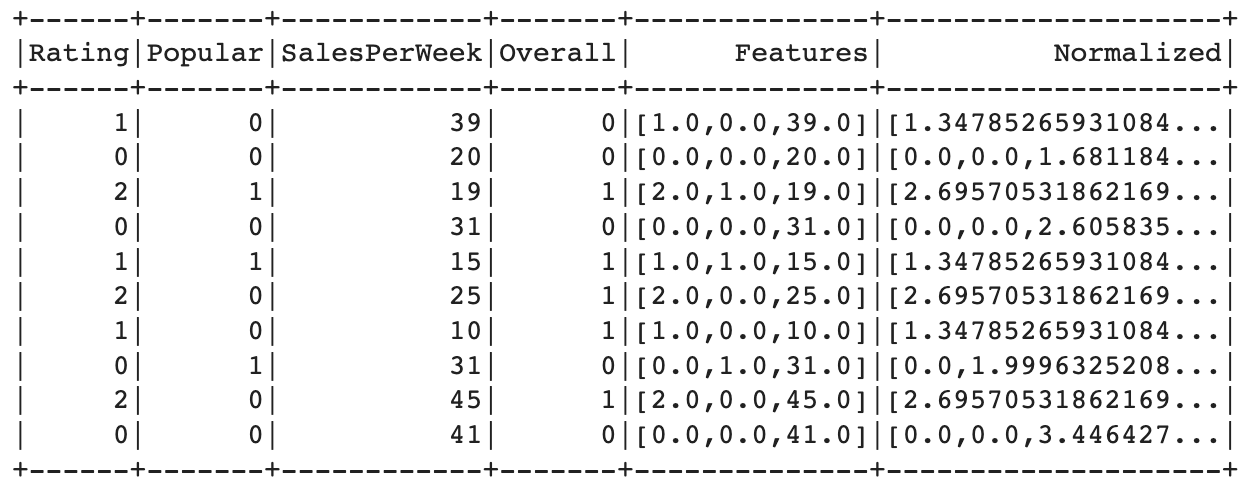
Normalization
The feature columns are assembled into a vector column called "Features" using `VectorAssembler`. The "Overall" column is removed from the list of columns before vector assembly. Feature scaling (normalization) is applied using `StandardScaler` to standardize the "Features" column, creating a new column called "Normalized".
Generate Model
A logistic regression model is generated using `LogisticRegression`. The model uses the "Normalized" column as the input feature column and the "Overall" column as the label column. The maximum number of iterations for model training is set to 20. The model is trained on the training dataset using the `fit()` method. The trained model is used to make predictions on the testing dataset using the `transform()` method, resulting in a new DataFrame called "prediction" that includes the original features and a "prediction" column with the predicted class labels (0 or 1).
Model Testing and Evaluation
Model testing and evaluation are performed using `BinaryClassificationEvaluator`.
The evaluator takes the "Overall" column as the label column
and computes the area under the receiver operating characteristic (ROC) curve,
which is a common metric for binary classification evaluation.
The area under the curve (AUC) is printed as a percentage,
indicating the performance of the logistic regression model in classifying the games.
Accuracy : 96.31594741859179 = 96,3%